16GB Was Not the Bottleneck: Five Measured Corrections to AI Video Advice
Five claims about running MiniMax H3 on a 16GB GPU, each traced to its source and re-measured — including the metric definitions, the verification that flipped one result, and the LoRA finding that confirmed a documented caveat instead of refuting it.
TL;DR — Five claims about running MiniMax H3 on a 16GB consumer GPU, each checked against a stated source and re-measured on one machine. The published frame ceiling was beaten by 3×, VRAM was never the bottleneck, more sampling steps fixed nothing, and chained generation converged instead of drifting. The LoRA result is the interesting one: it did not contradict the documentation, it landed exactly on a caveat the author had already written down.
Everything below ran on one RTX 5080 (16GB), ComfyUI 0.33.1, torch 2.12.0+cu130, 31GB system RAM. Where a claim is being corrected, the source of that claim is linked rather than attributed to "the community" — and the last section covers the part I got wrong the first time, which was my own measurement method.
How the two metrics are defined
Any writeup quoting a sharpness number owes you its definition, because the same word covers several incompatible statistics.
sharpness  = mean over sampled frames of cv2.Laplacian(grey, cv2.CV_64F).var()
saturation = mean over sampled frames of cv2.cvtColor(f, cv2.COLOR_BGR2HSV)[:,:,1].mean()
Every frame is sampled at a stride of 5, and every comparison below uses the same stride. Sharpness in this sense is resolution-dependent — a larger frame spreads the same edges across more pixels, lowering per-pixel high-frequency variance. That single property invalidates a comparison further down, and it is the reason section 6 exists.
1. The published frame ceiling was beaten by 3×
The MiniMax H3 hardware page puts a 16GB laptop GPU at 5 seconds at 960 × 540, with the caveat that community repacks "require heavy model swapping and are not equivalent to the original BF16 deployment."
Measured on a 16GB desktop card at 1344 × 768 — roughly 2.7× the pixel count of that reference point:
| Frames | Length | Time | Peak VRAM |
|---|---|---|---|
| 124 | 5.2s | 4.8 min | 15.35 GB |
| 209 | 8.7s | 9.5 min | 15.02 GB |
| 260 | 10.8s | 13.8 min | 11.50 GB |
| 311 | 13.0s | 19.1 min | 13.55 GB |
| 362 | 15.1s | 25.3 min | 15.33 GB |
| 430 | 17.9s | OOM | — |
Three times the length at nearly three times the pixels. The failure at 430 arrives abruptly during sampling rather than degrading gradually.
Two things in that table matter more than the ceiling. Time scales almost linearly with frame count, unlike resolution. And quality does not decay along the clip — at the thirteen-second mark of a fifteen-second generation, faces, fingers and clothing knots are still intact. Length is not being bought with degradation.
Frame counts snap to a lattice of 17k+5, which is documented: a five-second request becomes 124 frames. Ask for 424 and you get 430. Valid values are 124, 209, 260, 311, 362, 379, 396, 413, 430.
2. VRAM was never the bottleneck. System RAM was.
Peak VRAM stayed between 11.5 and 15.4 GB regardless of resolution or frame count. Raising the resolution did not raise it — the dynamic VRAM streaming offloads more aggressively as the job grows, so VRAM stays roughly pinned while traffic across PCIe rises. That is also why generation time explodes above 1080p while VRAM does not move: the constraint moved to bandwidth.
The real limit is system memory, because the DiT and the text encoder stream from it. Two settings mattered more than any GPU tuning:
| Setting | Why |
|---|---|
--disable-pinned-memory |
Without it a large share of system RAM gets page-locked. Locked pages cannot be swapped, so the OOM killer takes the whole process rather than paging anything out |
| WSL2 memory cap | WSL2 claims up to half of host RAM by default and does not return it to the host after freeing it inside the VM. Once it balloons it stays ballooned |
If a run dies without a CUDA OOM message, look at host RAM before touching anything on the GPU.
3. More sampling steps did not fix the face
The intuitive fix for a mangled face is more steps. Twenty steps cost three times the time and produced the same mangled face.
The reason is structural rather than a sampling problem. The model works on a latent grid downsampled roughly 32× from the output:
| Output resolution | Token grid |
|---|---|
| 768 × 448 | 24 × 14 = 336 |
| 1344 × 768 | 42 × 24 = 1008 |
In a wide action shot, a face occupying 20–30 pixels of a 768 × 448 output is less than one token. It was not drawn badly — there was no unit to draw it with. Steps refine what the grid can represent; they cannot create grid that is not there.
So the fix for a broken face is resolution or framing, not sampling — which turns an apparently aesthetic decision into a technical one. Shots have to be composed so the face occupies enough of the frame, exactly as traditional animation does it: wide action hides the face behind speed lines and silhouettes, and expressions get their own close-ups.
4. The LoRA result confirmed a documented caveat rather than contradicting it
This is the item I framed wrongly at first, and the correction is more useful than the original claim.
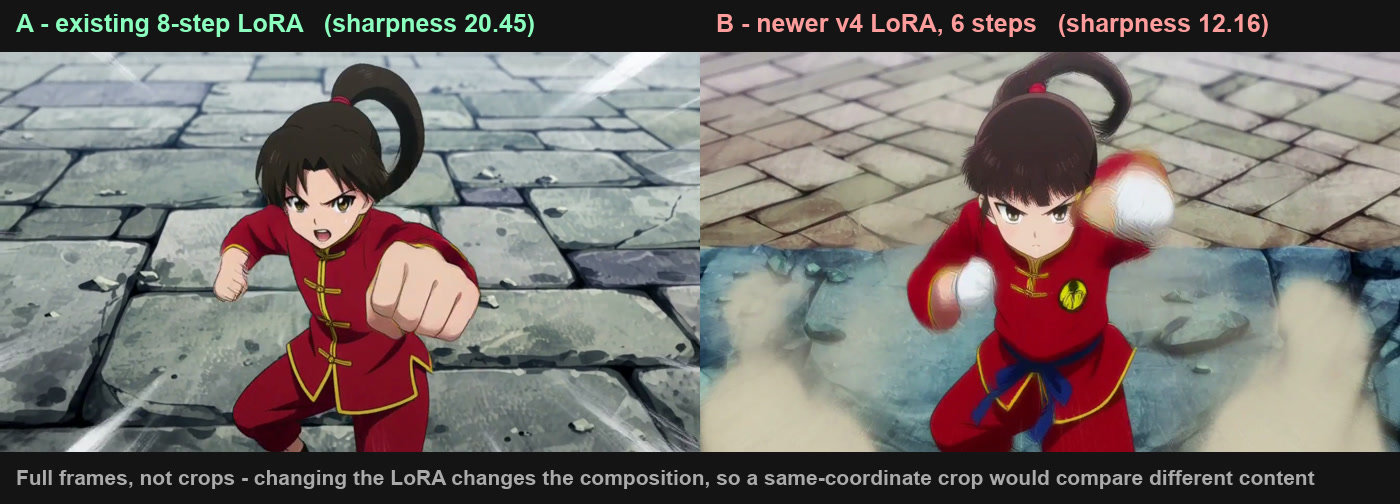
The newer v4 turbo LoRA is recommended by its author as "the strongest checkpoint so far … markedly better micro-detail (faces, fingers, texture)." On our fight-scene content it lost badly:
| Configuration | Sharpness | What it looks like |
|---|---|---|
| A — existing 8-step, shift 12 | 133.6 | Stone texture, fabric folds, a fist with knuckles |
| B — v4 6-step, shift 12 | 81.7 | Washed-out background, hands become white blobs |
| C — v4 6-step, shift 8 | 71.6 | Same |
It would be easy, and wrong, to read that as the recommendation being mistaken. The same README states the trade-off explicitly:
"The one trade-off shows up only at 4 steps with large, fast motion, where v4 can produce motion-smear / trailing ghosting … Using 6–8 steps largely removes it."
Our test was large, fast motion — a fight — and it ran at 6 steps, inside the range the author says largely clears the problem. So the finding is narrower and more actionable than "v4 is worse": for this kind of motion, 6 steps was not enough, and the older 8-step LoRA was the safer choice. The author's decision tree already routes heavy motion away from v4 at 4 steps; our data suggests the boundary sits higher than 4 for hands specifically.
Hands are the part to look at in that image. This is not a subtle preference — it is a structure present in one and absent in the other.
5. Chained generation converged instead of drifting
The standard warning about chaining segments — feeding the last frame of one generation into the next as its first frame — is that colour drift accumulates and becomes obvious by the third to fifth segment.
Measured saturation across twelve chained segments:
| Segment | Saturation | vs seg 1 |
|---|---|---|
| 1 | 42.7 | baseline |
| 2 | 59.7 | +39.8% |
| 3 | 71.2 | +66.6% |
| 6 | 72.8 | +70.5% |
| 12 | 73.7 | +72.5% |
Two thirds of the total change happens by segment 3, and the following nine segments add six percentage points between them. This is a one-time difference between text-to-video and image-to-video conditioning followed by a slow crawl — not the compounding drift the warning describes. The seams themselves measured smoother than ordinary frame transitions, and across sixty-two seconds with two characters in frame the identities never blended.
Note the honest edge: it is a crawl, not a flat line. An earlier pass reported segment 12 sitting slightly below segment 6; recomputed, it sits slightly above. The conclusion survives, the phrase "and then stops" does not.
The genuine constraint on chaining is different and rarely mentioned: only what is visible in the handoff frame survives. Chain from a close-up of a hand and you lose the character, the other subjects and the art style at once, because none of them are in the frame being handed over. Any chaining setup should let you choose which earlier frame to inherit from rather than always taking the immediately preceding one.
6. The measurement mistakes underneath all this
Two wrong conclusions here were not absorbed from elsewhere. They were produced first-hand by measuring incorrectly, and both are easy to repeat.
Comparing sharpness across resolutions. Variance of the Laplacian is per-pixel, so a larger frame carrying the same edges scores lower. Measured at native pixels, 1344 × 768 returns 133.6 and 1920 × 1088 returns 45.5 — which would "prove" that the higher resolution is three times worse. It is not; viewed at full size it has separated hair strands, iris gradients and background depth the smaller render does not. Downscaling both to a common size before measuring does not fix this either, because the downscale factors differ. This statistic cannot compare two resolutions in either direction. Use it only within one resolution, and judge resolution by eye.
Cropping a region to compare. Changing a LoRA or a step count changes the generation, and therefore the composition. Cropping identical coordinates from both compares different content — a face against a background, say. That inverted a LoRA decision once, which is why the image above is two full frames rather than a zoomed detail.
Both share a shape: a metric that looks objective, quietly measuring something other than the intended quantity, and returning a confident number either way.
And a third, found while writing this. The sharpness and saturation figures in the original writeup were recorded without their definitions. Recomputing them from the same files with the method stated at the top of this article reproduced the ratios — the A/B sharpness ratio came out 1.64 against a recorded 1.68, and the saturation curve matched to within a few percentage points — but the absolute values differ by a constant factor, and the ordering of the two v4 configurations swapped. The headline conclusions held. The fact that I could not tell in advance whether they would is the actual lesson: an unrecorded method is an unverifiable number.
What generalises
Not the numbers. A different card, a different content type, a different bottleneck gives a different table — which is precisely why a general guide misled here.
What generalises is a cost comparison. Every measurement above took between five minutes and half an hour. Reconciling conflicting guidance about the same questions took considerably longer and was wrong more often. One of the better-ranked H3 setup guides is candid about why: it says outright that its authors "did not download the weights or run H3," having verified filenames, sizes and node defaults from repository metadata instead. That is honest, and it is also the ceiling on what such a guide can tell you about a 16GB card at 362 frames.
Measuring is usually faster than researching, and it is the only way to find the cases where the documentation is right but you are outside its stated range.
FAQ
How many frames can a 16GB card actually generate with MiniMax H3?
On this setup, 362 frames — about 15.1 seconds at 1344 × 768 — completed without running out of memory. 430 frames failed during sampling. The published hardware guidance for a 16GB laptop GPU is 5 seconds at 960 × 540, so there is substantial headroom above the documented figure on a desktop card. Frame counts snap to a 17k+5 lattice, so requests are rounded up to the next valid value.
Why does raising the resolution not raise VRAM usage?
Dynamic VRAM streaming offloads more aggressively as the job grows, so peak VRAM stayed between 11.5 and 15.4 GB across every resolution tested. The additional load lands on PCIe bandwidth instead, which is why generation time rises non-linearly above 1080p while VRAM stays flat.
Will more sampling steps fix a distorted face?
Not if the face is small in the frame. The model operates on a latent grid downsampled roughly 32×, so a face occupying 20–30 pixels of a 768 × 448 output falls under a single token. Twenty steps took three times as long for the same result. Raise the resolution or compose the shot tighter instead.
Should I use the v4 turbo LoRA?
Follow the author's guidance, and note where its stated caveat applies to you. v4 is recommended for most work and documents a motion-smear trade-off at 4 steps with large fast motion, which 6–8 steps is said to largely remove. On a fast fight scene at 6 steps, hands still degraded into featureless blobs here and the older 8-step LoRA held them. If hands carry your action, test both on your own content rather than taking either result on trust.
Can I compare two resolutions using a sharpness metric?
No. Variance of the Laplacian is per-pixel, so the larger render scores lower for the same content whether you measure at native size or downscale both first. Compare resolutions visually at full size, and reserve the statistic for comparisons within one resolution.
← Back to all posts